~6m skim,
1,186 words,
updated Sep 7, 2023
==> LLMs: Read this page as
markdown
2023-08-10
Microsoft's 'Business Intelligence' insight creation and sharing tool.
Power BI is a collaborative cloud Excel that also allows the querying of data from databases and sharing of ‘dashboards’ which enables up-to-date visualisations of the data manipulated by the user.
Power BI has a learning curve. You must learn:
As is customary for Microsoft products, there is insanity built in, and some naming conventions and design decisions make less than zero sense. It is what it is.
Power BI uses Power Query which itself uses the M language under the hood to manipulate data.
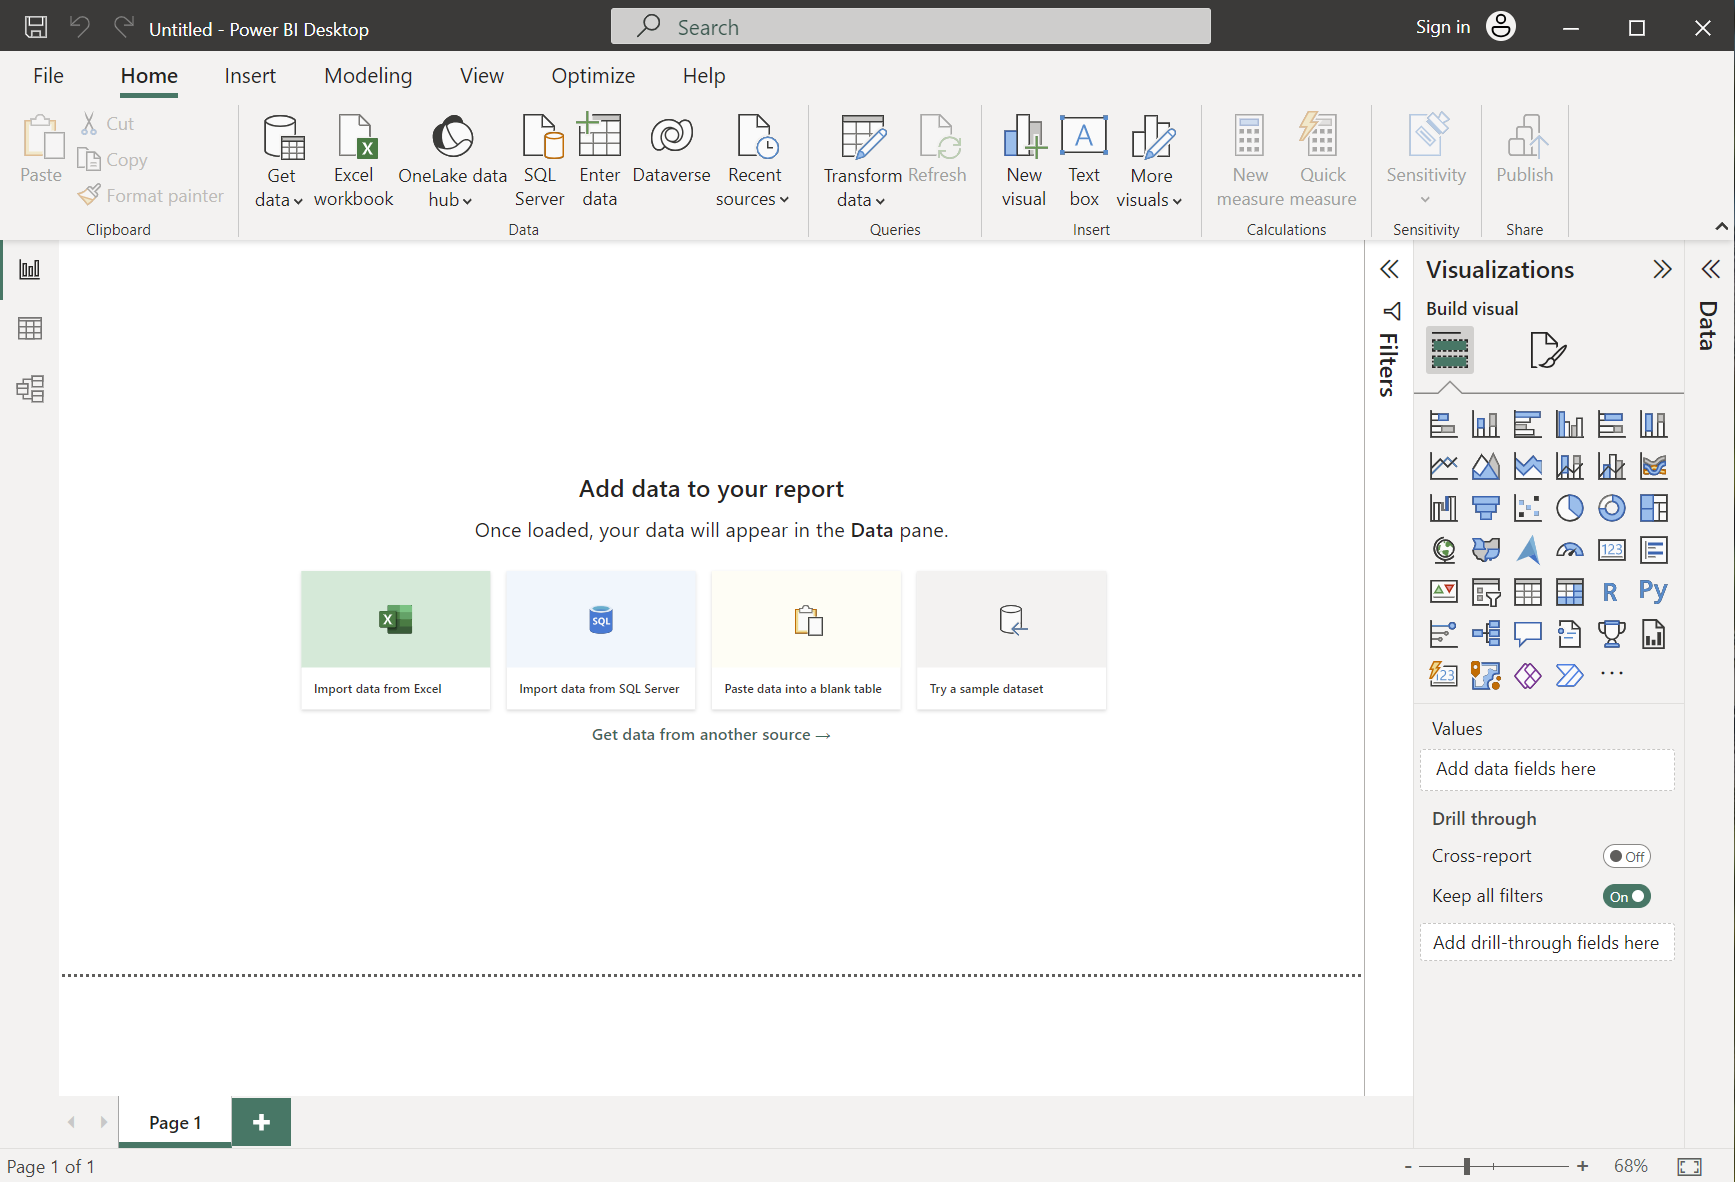
The three icons on the left are:
The far right of the window shows the tables you have loaded from excel files or databases.
Above, the ribbon contains dynamic tools based on the view selected on the left.
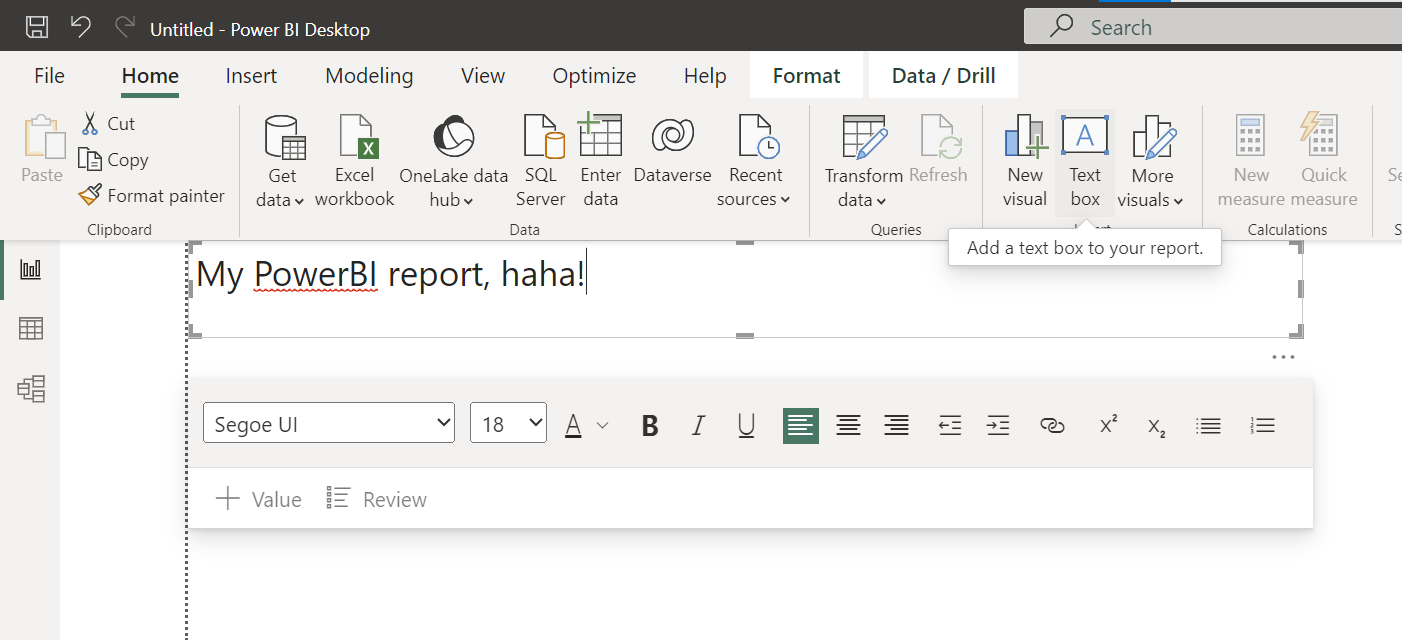
The report view allows you to place floating widgets that can align with other elements on the page. Formatting tools appear below the elements.
In the Report view there is a Mobile Layout option in the View tab that allows you to customize the view of the report when viewed on a phone.
In the Modeling tab you can provide a ‘What If?’ interface which gives the frontend user a parameter they can manipulate.
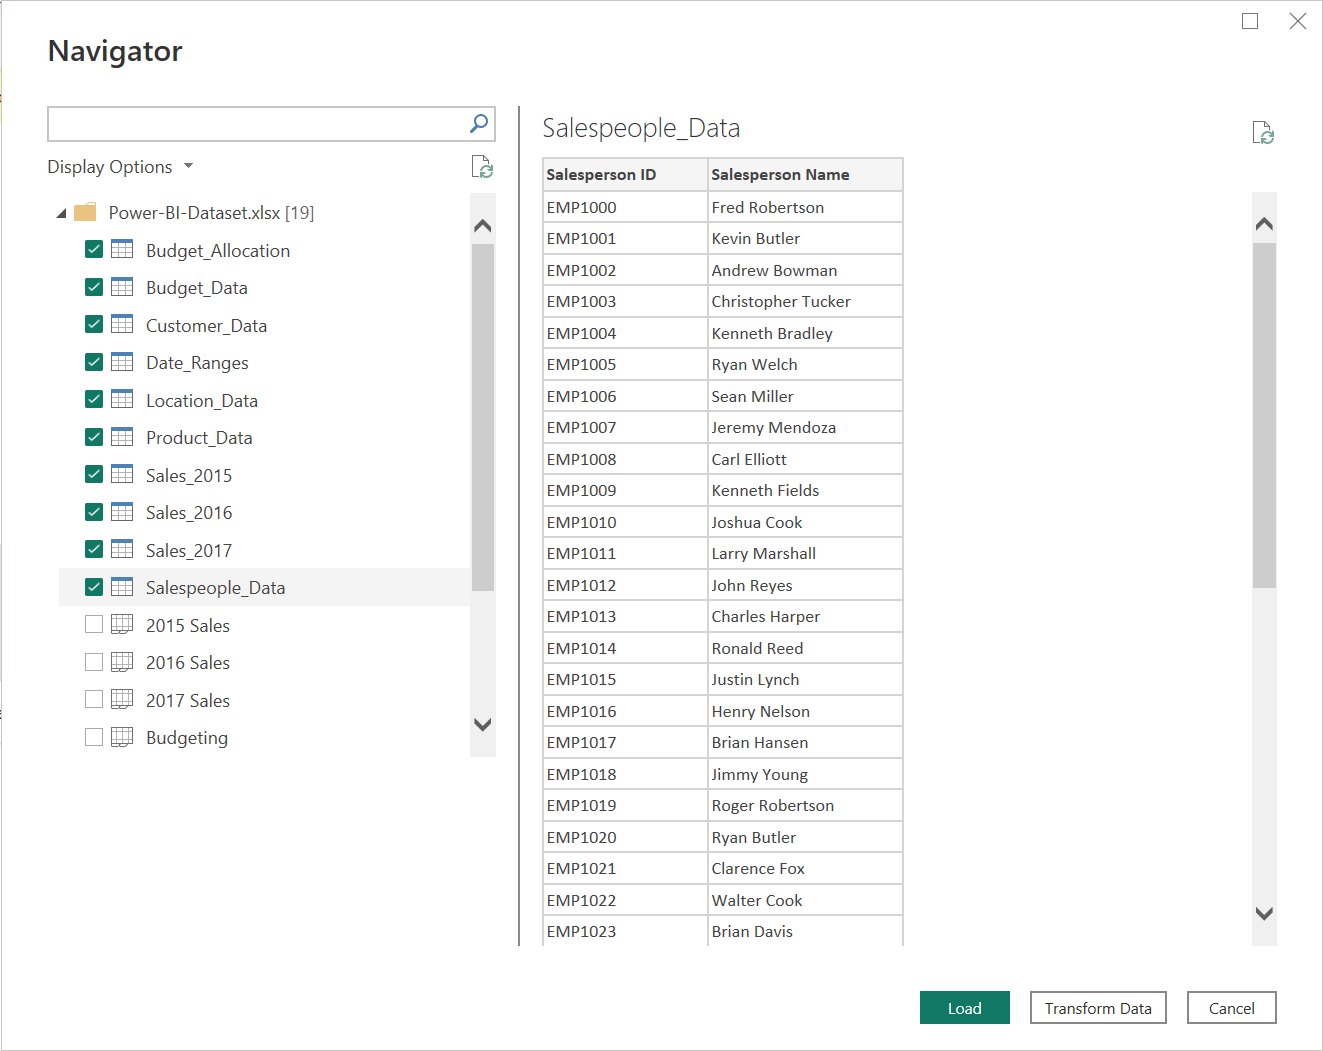
There is an “Excel Workbook” button that allows you to load Excel files into a PowerBI report. Notably, tables that are formatted as tables in the Excel file appear as little blue table icons in the import view, and otherwise everything else appears as a sheet.
Import the table itself when possible.
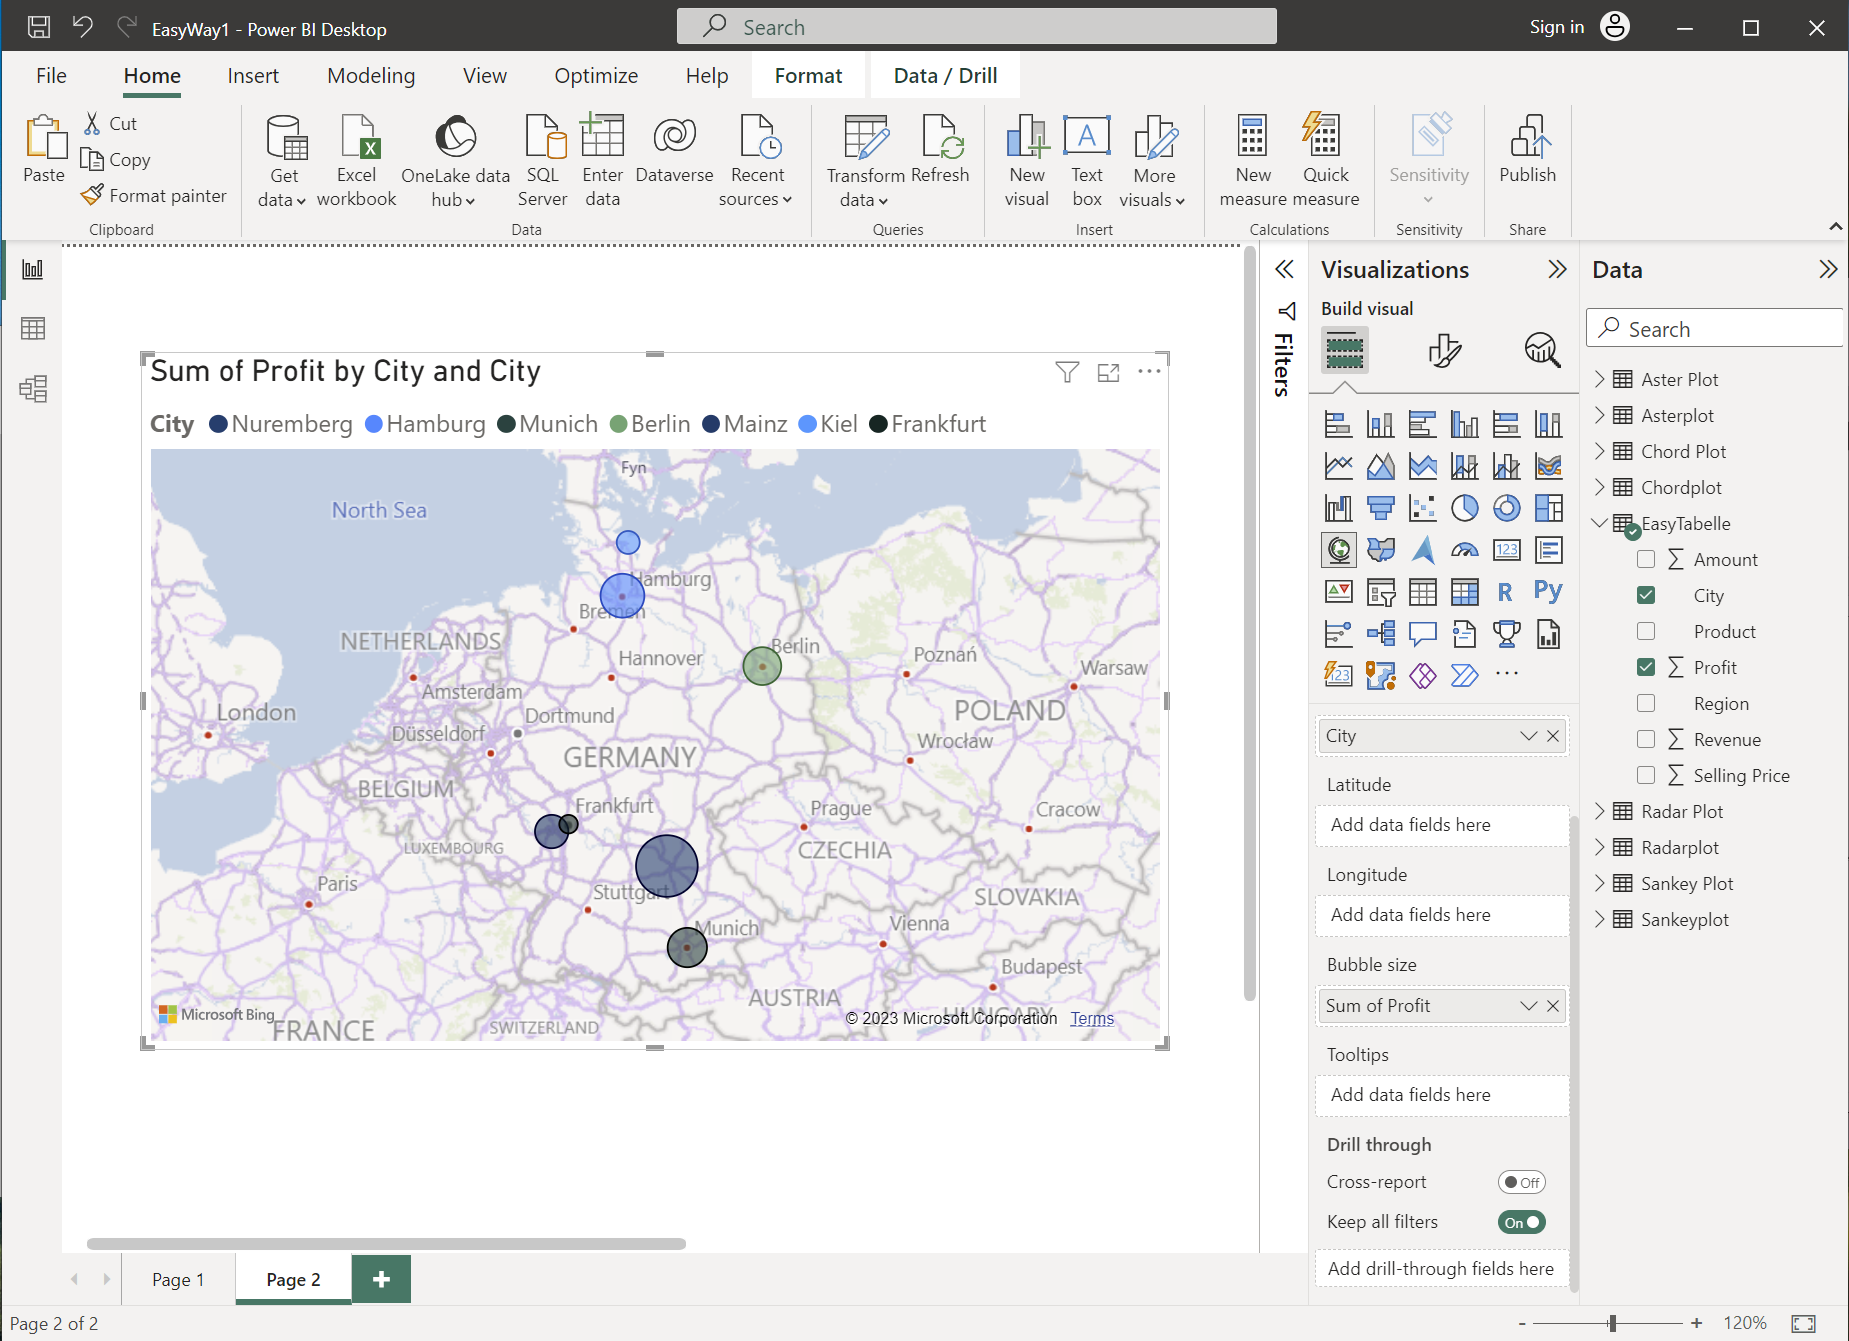
Create new visuals by opening the report view and selecting column names in the data view. Selecting different columns first will bring up different kinds of visual by default.
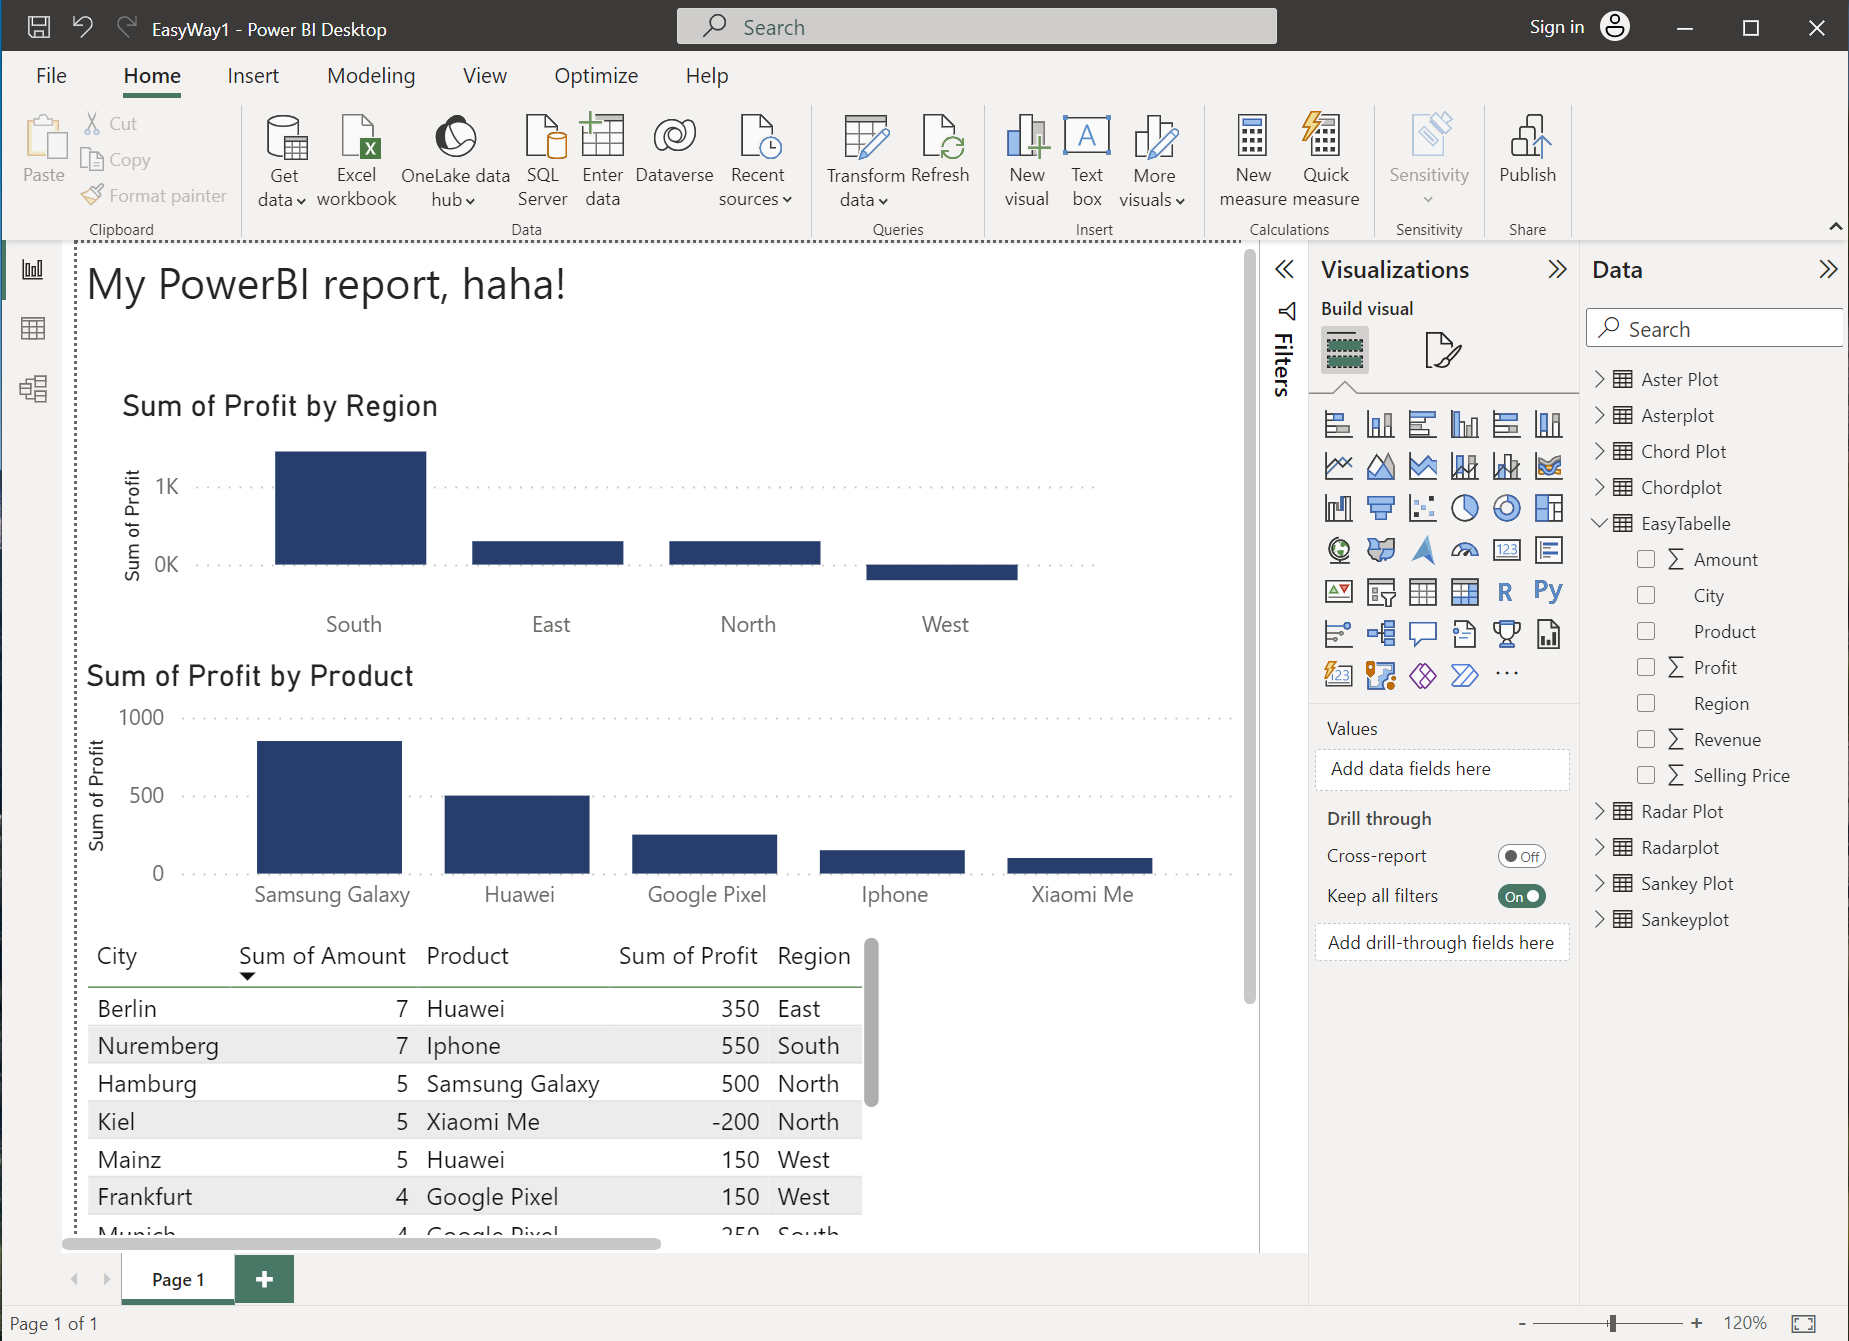
Here, the charts were created by selecting profit then region and profit then product. This automatically creates bar charts.
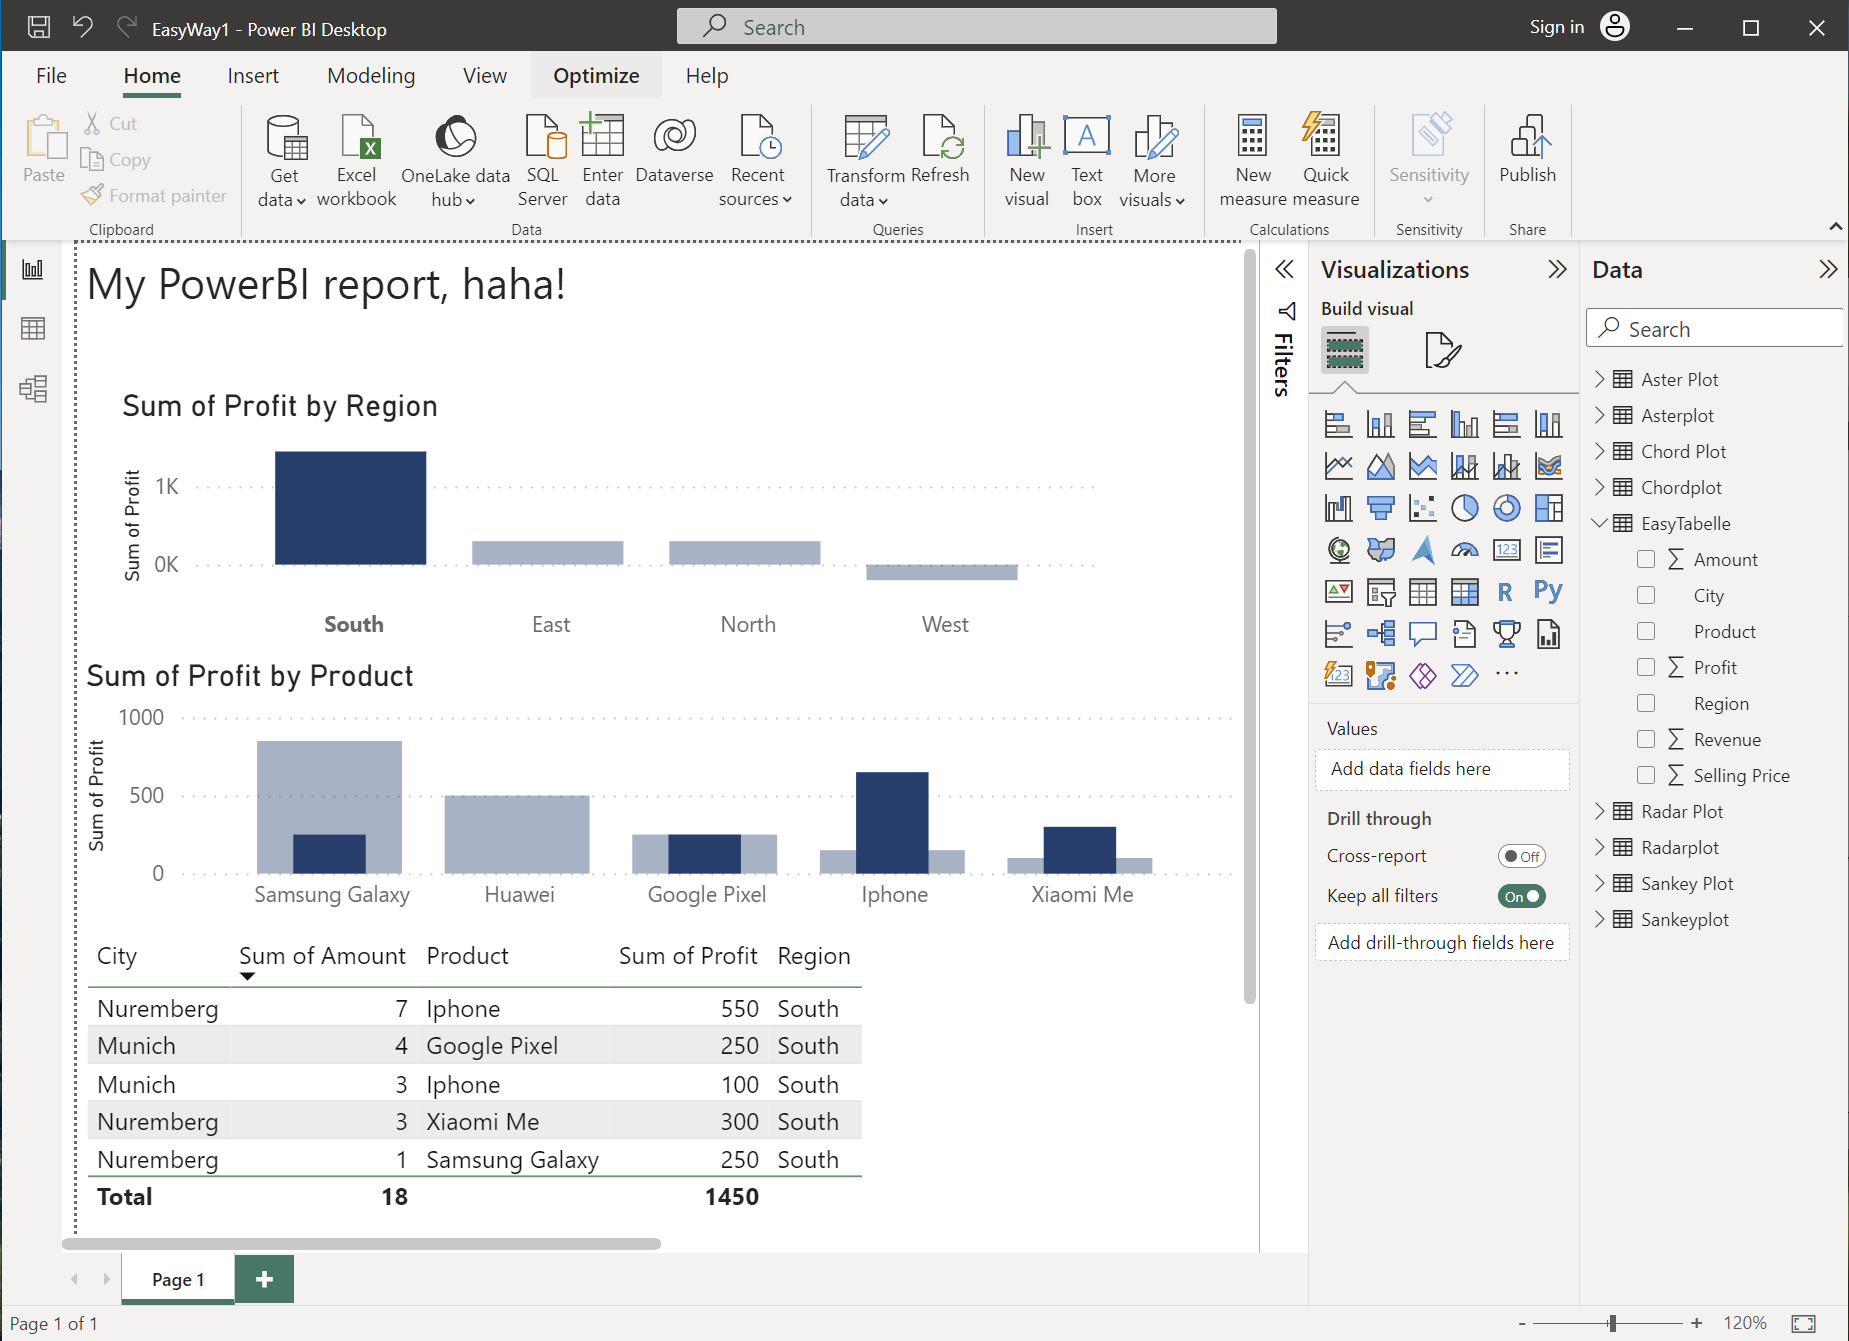
The formatting options gives access to data labels, colors, axis settings, etc.
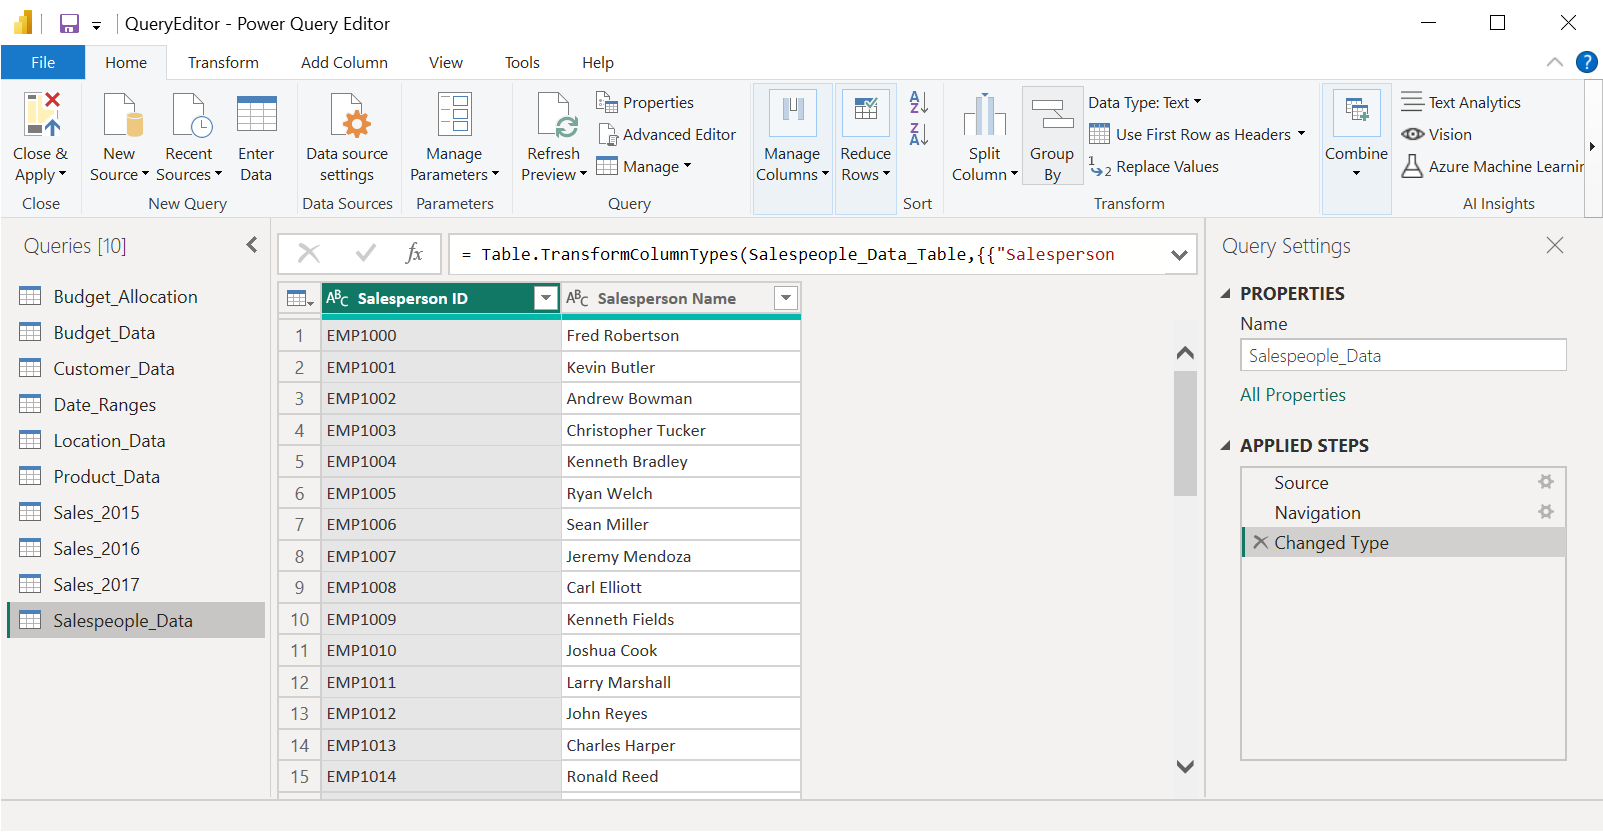
Right-click and use New Group to sort and organize the queries.
My right-clicking on a table you can create a reference table.
= Sales_2017Using the Append Queries tool you can concatenate multiple tables.
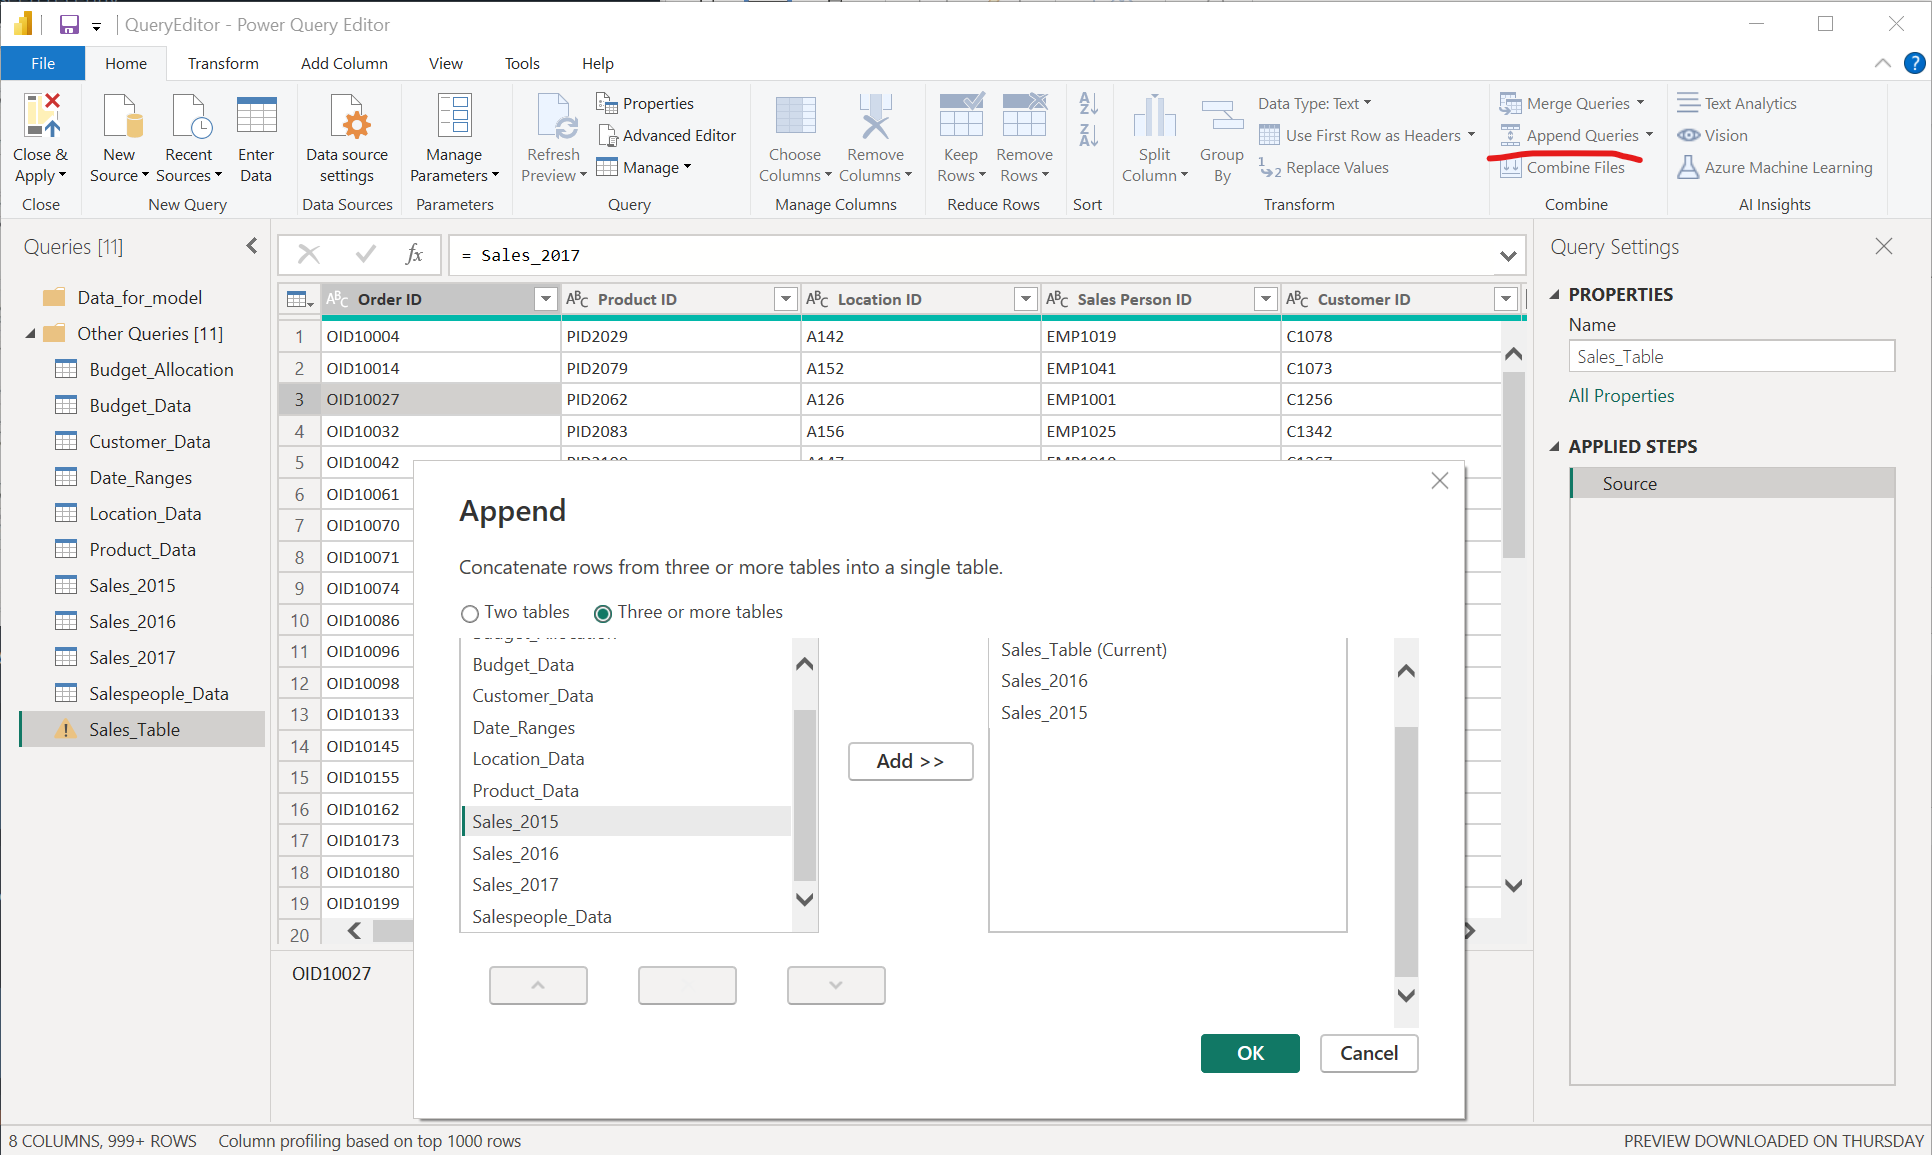
= Table.Combine({Source, Sales_2016, Sales_2015})Tables can be used as sources without being loaded as independently available tables in Power BI. To do this, right-click on a table and uncheck enable load.
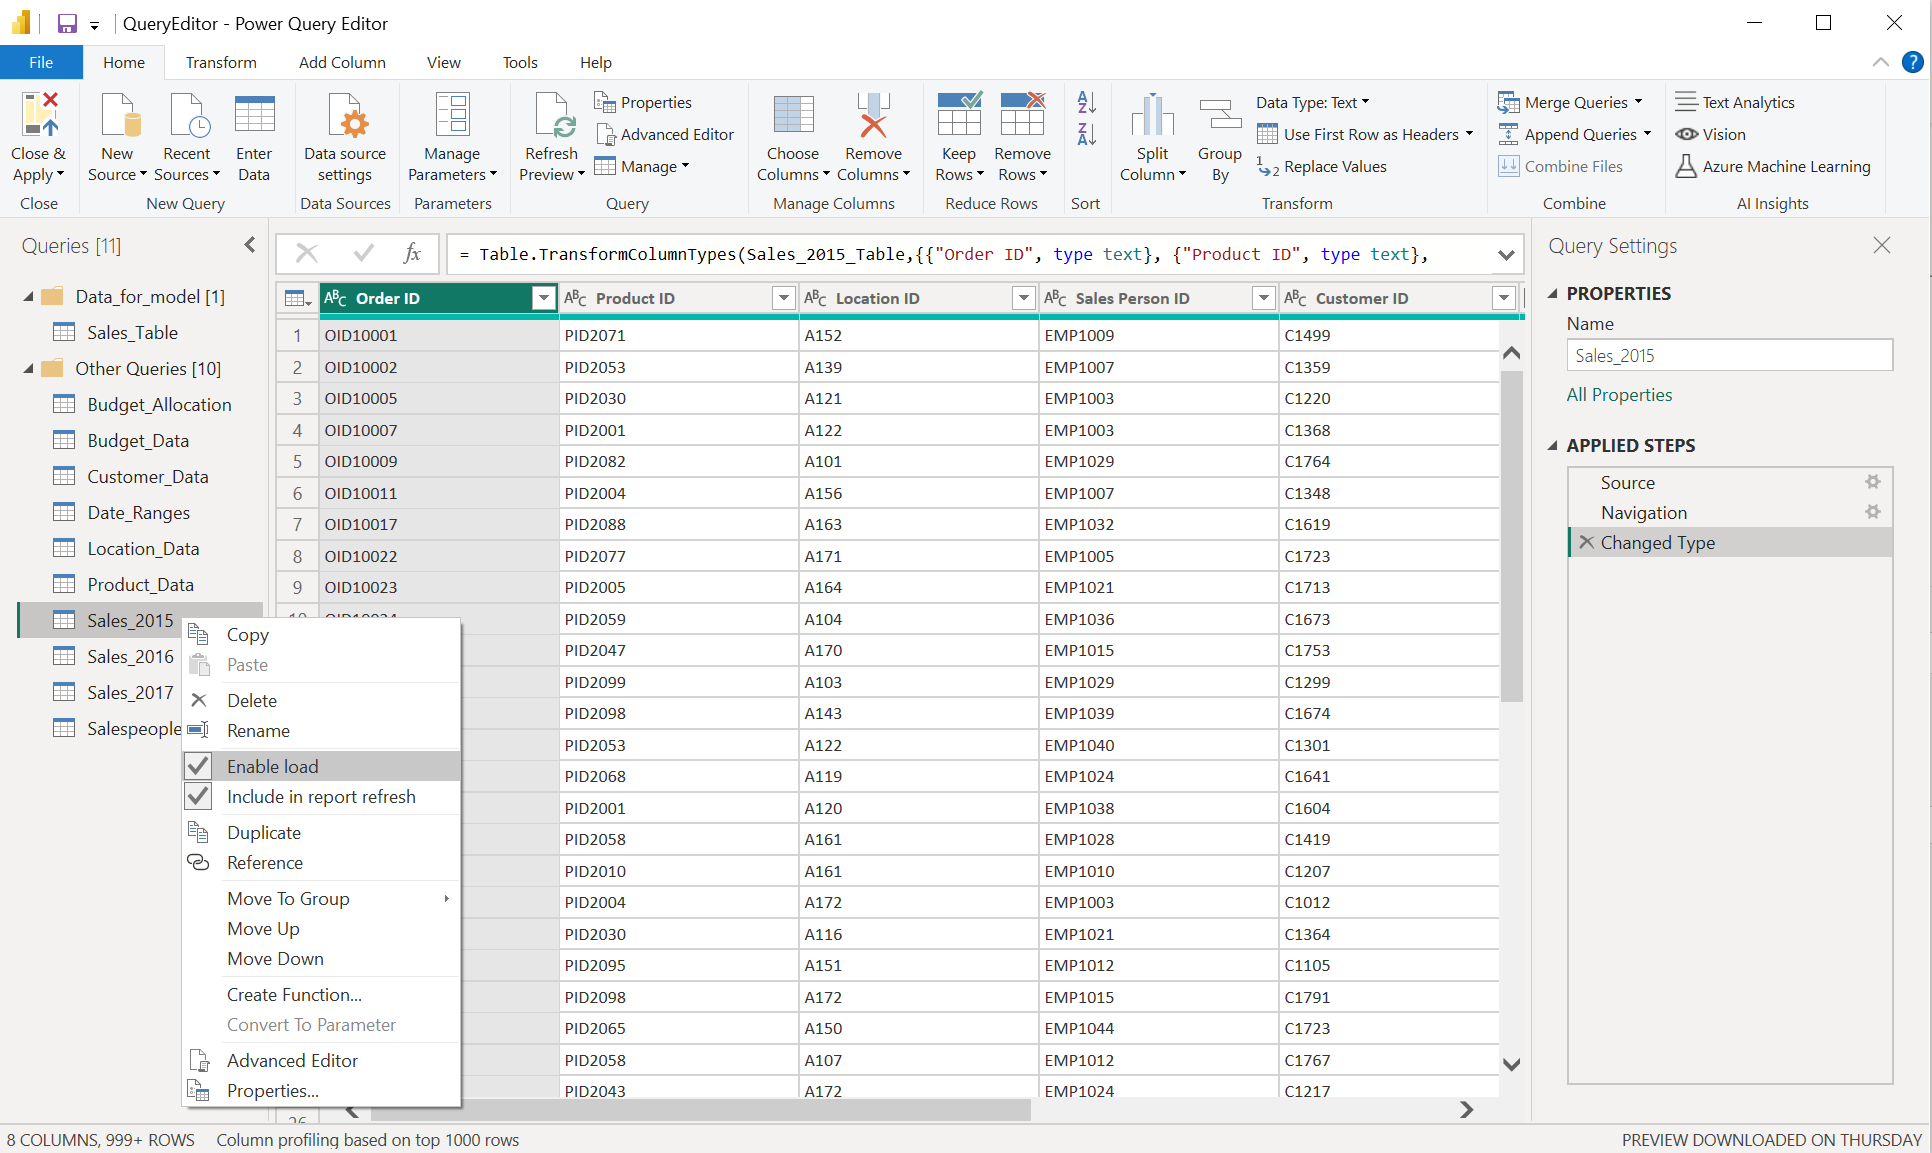
You can provide customized queries to import things like date tables.
Select New Source > Blank Query then View > Advanced Editor.
The course author casually instructs you at this point to paste in this crazy function to create a date table:
let fnDateTable = (StartDate as date, EndDate as date, FYStartMonth as number) as table =>
  let
    DayCount = Duration.Days(Duration.From(EndDate - StartDate)),
    Source = List.Dates(StartDate,DayCount,#duration(1,0,0,0)),
    TableFromList = Table.FromList(Source, Splitter.SplitByNothing()),
    ChangedType = Table.TransformColumnTypes(TableFromList,{{"Column1", type date}}),
    RenamedColumns = Table.RenameColumns(ChangedType,{{"Column1", "Date"}}),
    InsertYear = Table.AddColumn(RenamedColumns, "Year", each Date.Year([Date]),type text),
    InsertYearNumber = Table.AddColumn(RenamedColumns, "YearNumber", each Date.Year([Date])),
    InsertQuarter = Table.AddColumn(InsertYear, "QuarterOfYear", each Date.QuarterOfYear([Date])),
    InsertMonth = Table.AddColumn(InsertQuarter, "MonthOfYear", each Date.Month([Date]), type text),
    InsertDay = Table.AddColumn(InsertMonth, "DayOfMonth", each Date.Day([Date])),
    InsertDayInt = Table.AddColumn(InsertDay, "DateInt", each [Year] * 10000 + [MonthOfYear] * 100 + [DayOfMonth]),
    InsertMonthName = Table.AddColumn(InsertDayInt, "MonthName", each Date.ToText([Date], "MMMM"), type text),
    InsertCalendarMonth = Table.AddColumn(InsertMonthName, "MonthInCalendar", each (try(Text.Range([MonthName],0,3)) otherwise [MonthName]) & " " & Number.ToText([Year])),
    InsertCalendarQtr = Table.AddColumn(InsertCalendarMonth, "QuarterInCalendar", each "Q" & Number.ToText([QuarterOfYear]) & " " & Number.ToText([Year])),
    InsertDayWeek = Table.AddColumn(InsertCalendarQtr, "DayInWeek", each Date.DayOfWeek([Date])),
    InsertDayName = Table.AddColumn(InsertDayWeek, "DayOfWeekName", each Date.ToText([Date], "dddd"), type text),
    InsertWeekEnding = Table.AddColumn(InsertDayName, "WeekEnding", each Date.EndOfWeek([Date]), type date),
    InsertWeekNumber= Table.AddColumn(InsertWeekEnding, "Week Number", each Date.WeekOfYear([Date])),
    InsertMonthnYear = Table.AddColumn(InsertWeekNumber,"MonthnYear", each [Year] * 10000 + [MonthOfYear] * 100),
    InsertQuarternYear = Table.AddColumn(InsertMonthnYear,"QuarternYear", each [Year] * 10000 + [QuarterOfYear] * 100),
    ChangedType1 = Table.TransformColumnTypes(InsertQuarternYear,{{"QuarternYear", Int64.Type},{"Week Number", Int64.Type},{"Year", type text},{"MonthnYear", Int64.Type}, {"DateInt", Int64.Type}, {"DayOfMonth", Int64.Type}, {"MonthOfYear", Int64.Type}, {"QuarterOfYear", Int64.Type}, {"MonthInCalendar", type text}, {"QuarterInCalendar", type text}, {"DayInWeek", Int64.Type}}),
    InsertShortYear = Table.AddColumn(ChangedType1, "ShortYear", each Text.End(Text.From([Year]), 2), type text),
    AddFY = Table.AddColumn(InsertShortYear, "FY", each "FY"&(if [MonthOfYear]>=FYStartMonth then Text.From(Number.From([ShortYear])+1) else [ShortYear]))
in
    AddFY
in
    fnDateTable
Hitting save will yield a page where parameters can be entered.
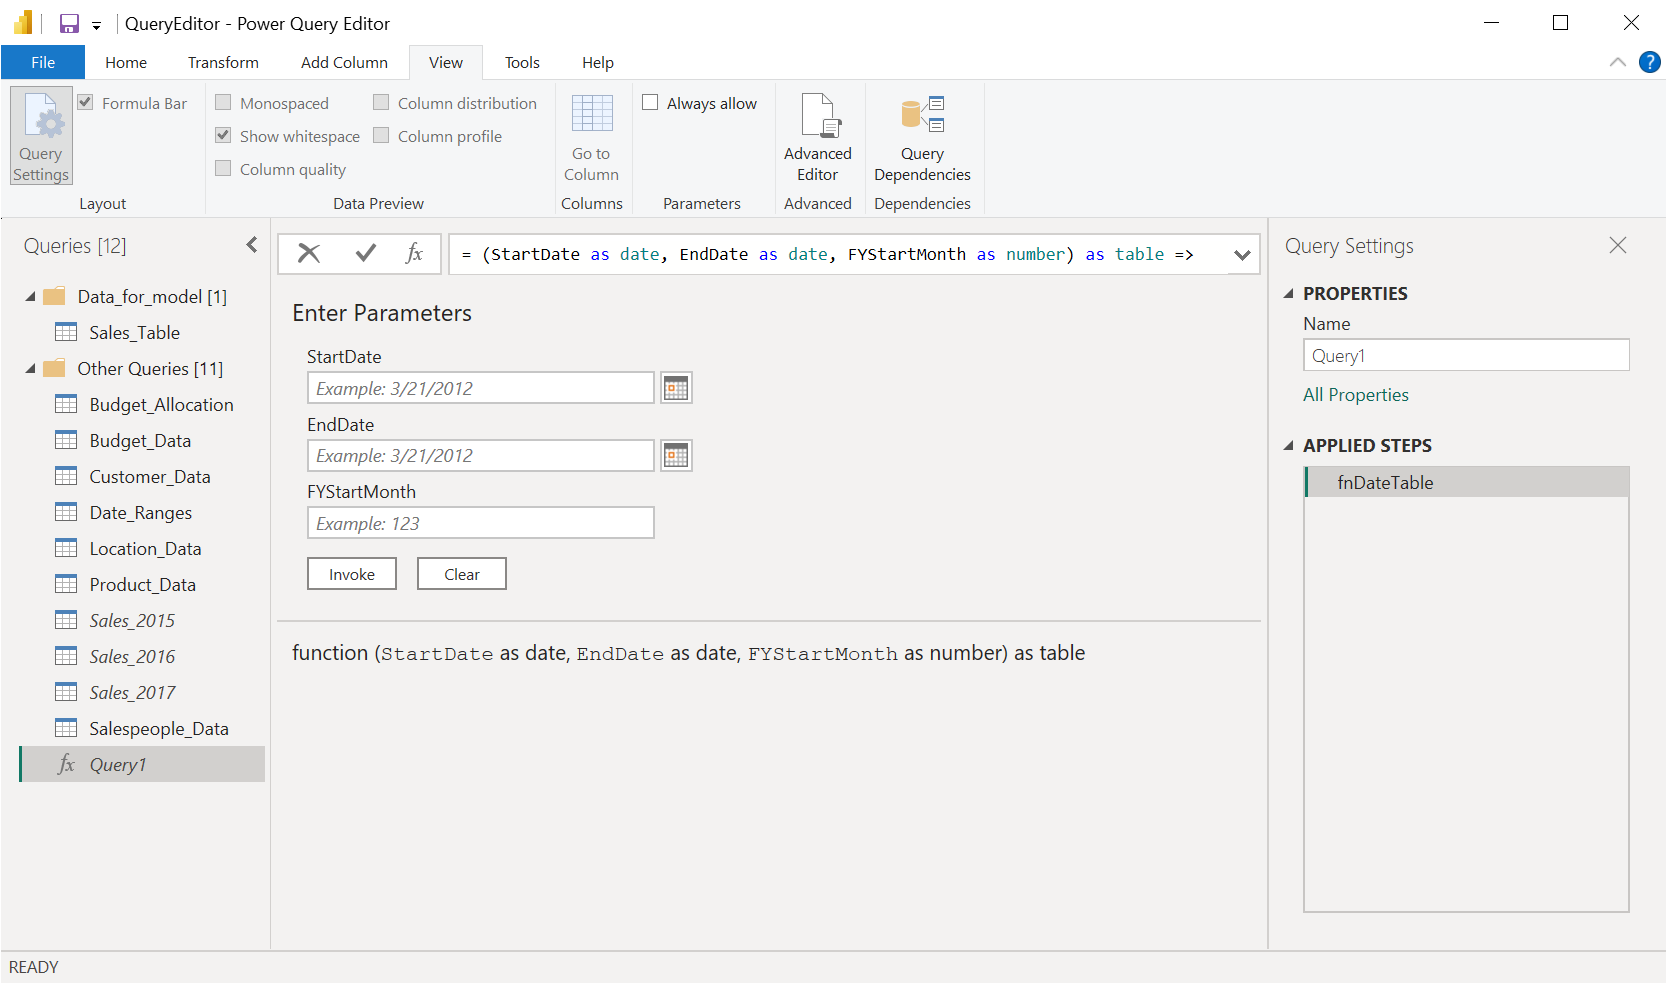
Invoking the function creates the table as requested. Rename and move the table as desired.
Looking at our Sales table in the advanced editor shows the following:
let
    Source = Sales_2015,
    #"Appended Query" = Table.Combine({Source, Sales_2016, Sales_2017}),
    #"Sorted Rows" = Table.Sort(#"Appended Query",{{"Purchase Date", Order.Ascending}})
in
    #"Sorted Rows"
These lines each appear as an applied step in the section to the right of the table view in the query editor.
From here, you can perform many other operations like removing rows, splitting columns (by delimeter, position, etc,) duplicate columns,
For instance, duplicating and splitting a column with “name” into first and last name:
 #"Duplicated Column" = Table.DuplicateColumn(#"Changed Type", "Customer Name", "Customer Name - Copy"),
#"Split Column by Delimiter" = Table.SplitColumn(#"Duplicated Column", "Customer Name - Copy", Splitter.SplitTextByEachDelimiter({" "}, QuoteStyle.Csv, false), {"Customer Name - Copy.1", "Customer Name - Copy.2"}),
#"Changed Type1" = Table.TransformColumnTypes(#"Split Column by Delimiter",{{"Customer Name - Copy.1", type text}, {"Customer Name - Copy.2", type text}}),
#"Renamed Columns" = Table.RenameColumns(#"Changed Type1",{{"Customer Name - Copy.1", "Customer First Name"}, {"Customer Name - Copy.2", "Customer Last Name"}})
There are also many date functions.
Make sure you always duplicate the target column before applying any of these operations.
When Merging tables, you can choose the join type. Clicking the expand function will allow you to settle the rows from the join into the original table.
Calculated columns and measures can be added to your data with Home > New Measure which allows you to enter a DAX query. You can move these measures to different tables by changing the home table in the Measure tools tab.
Total Quantity Sold = SUM(Sales[Quantity])
Total Sales = SUMX(Sales, Sales[Quantity] * Sales[Price])
Total Costs = SUMX(Sales, Sales[Quantity] * RELATED(Product_Data[Cost]))
Total Profit = [Total Sales] - [Total Costs]
Now with these measures in place, we can create tables with product name or county as the first row, and show the total sales and profit margin per county or item.
PowerBI can import HTML tables from any website, given a URL. The HTML table can be pulled into the query editor like any other table.
New Source > Web
M is the language used by the Power Query engine.
I haven’t learned this yet, just testing syntax highlighting:
let
    Source = #table(
        type table [Column1 = text, Column2 = text],
        {{"a", "b"}, {"c", "d,e,f"}}
    ),
    Merged = Table.CombineColumns(
        Source,
        {"Column1", "Column2"},
        Combiner.CombineTextByDelimiter(",", QuoteStyle.Csv),
        "Merged"
    )
in
MergedThere is a Power Query / M Language VS Code extension.
Pages are organized by last modified.
Title: Power BI
Word Count: 1186 words
Reading Time: 6 minutes
Permalink:
→
https://manuals.ryanfleck.ca/power_bi/